
A Beginner's Guide to Clinical Trial Phases, FDA Review Dates, Cash Runway, and the Risks of Clinical-Stage Biotech.
Biotech stock investing offers exposure to companies developing medicines, biologics, and other healthcare technologies. However, clinical-stage biotech stocks can experience sharp price changes after trial results or regulatory decisions. For beginners, understanding these events matters before evaluating a biotech investment.
This guide explains clinical trial phases, FDA catalysts, cash runway, patent protection, and commercial market potential. It also provides a practical framework for researching biotechnology companies and managing binary risk.
💡QUICK ANSWER: HOW DOES BIOTECH STOCK INVESTING WORK? Biotech investing involves evaluating clinical trial progress, FDA decisions, cash runway, patent protection, and commercial opportunities before purchasing biotechnology company shares. |
|---|
The Risks and Rewards of Small and Mid-Cap Biotech Firms
Biotechnology companies develop treatments using biological processes, scientific research, and advanced medical technologies. Their products may target cancer, genetic disorders, autoimmune diseases, or other medical conditions.
Unlike established pharmaceutical businesses, clinical-stage companies may generate little or no product revenue. Their valuations often depend on experimental treatments and expectations of future commercialization.
Small and mid-cap biotechnology equities can attract growth investors because new clinical evidence may substantially change a company's prospects. However, disappointing results can also reduce its estimated value.
Three characteristics make this sector different from traditional stock investing:
Scientific uncertainty: Experimental treatments may fail to demonstrate sufficient safety or effectiveness.
Regulatory uncertainty: FDA approval depends on evidence, manufacturing quality, and other regulatory requirements.
Financial uncertainty: Companies may need additional capital before generating sustainable revenue.
Investors researching biotech investment opportunities often examine companies developing new therapeutic approaches. These include gene therapies, targeted cancer treatments, RNA medicines, and peptide-based therapies.
However, a promising technology does not establish an attractive valuation. Investors should consider development costs, competitive treatments, financing requirements, and the likelihood of commercial adoption.
What Makes Clinical-Stage Biotech Stocks Different?
A clinical-stage company may depend heavily on one experimental treatment. Its market valuation can change considerably when new clinical data become available.
These price movements are often associated with binary risk. It describes an event with sharply different potential outcomes. A successful trial may support further development, while an unsuccessful trial may substantially weaken the investment case.
Actual outcomes are rarely completely binary. Partial results, safety concerns, regulatory delays, or requests for additional studies can create more complicated scenarios. For investors learning how to invest in clinical stage biotech, understanding this uncertainty is an important starting point.
Understanding the Drug Development Pipeline
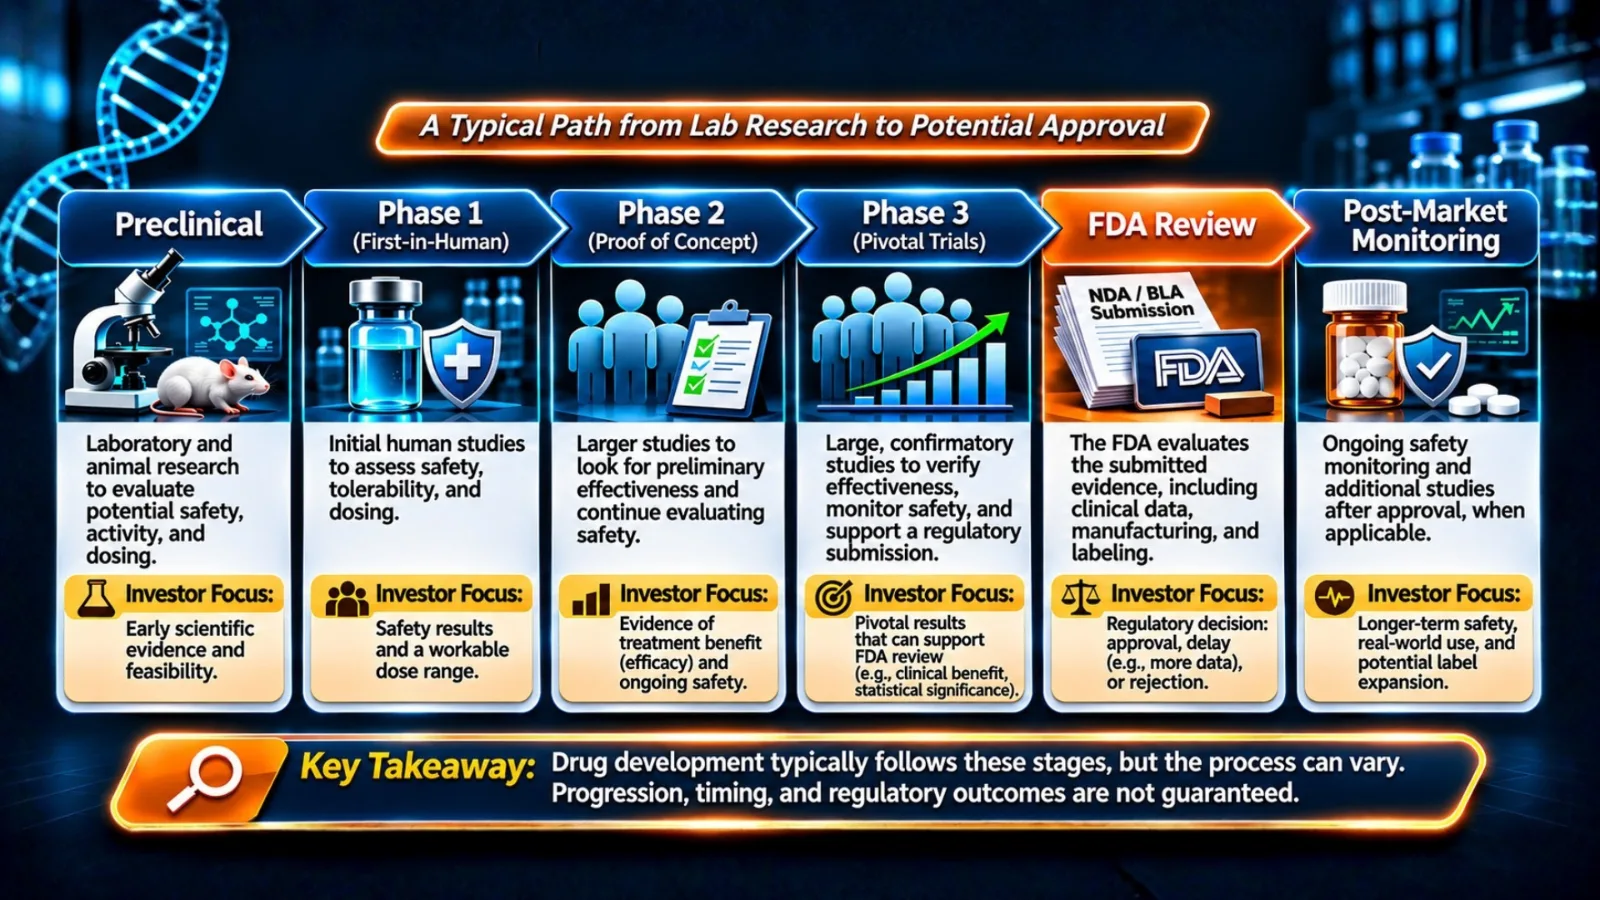
Drug development generally progresses from laboratory research to human clinical trials and regulatory review. The FDA describes several development stages, including preclinical testing, clinical research, agency review, and post-market safety monitoring. Each stage addresses different scientific and regulatory questions.
Development Stage | Primary Objective | Main Investment Consideration |
|---|---|---|
Preclinical | Laboratory and animal research | Early scientific uncertainty |
Phase 1 | Safety and dosing | Tolerability and pharmacology |
Phase 2 | Preliminary effectiveness and safety | Evidence of treatment benefit |
Phase 3 | Confirmatory evidence | Pivotal results and regulatory readiness |
FDA Review | Evaluate submitted evidence | Approval, delay, or rejection |
Phase 4 | Post-approval monitoring | Longer-term safety and use |
Source: FDA Drug Development Process.
These phases describe a typical pathway, not a fixed sequence for every product. Some development programs combine phases or follow different regulatory approaches.
Pre-Clinical & IND Applications
Preclinical research evaluates a potential treatment before testing it in humans. Researchers may examine biological activity, toxicity, drug behavior, and manufacturing characteristics.
Before starting most U.S. clinical drug investigations, the sponsor submits an Investigational New Drug (IND) application. The IND includes preclinical findings, manufacturing information, and proposed clinical protocols.
FDA review helps determine whether the investigation presents unacceptable risks to participants. The agency may place a clinical hold when significant concerns arise. For investors, IND progress represents an early development milestone rather than evidence of commercial success.
Phase 1: Safety & Dosing Dynamics
Phase 1 trials primarily investigate safety, tolerability, and dosing. Researchers examine side effects, how the body processes the drug, and the relationship between dosage and biological response. These studies often involve relatively small participant groups. Certain cancer studies enroll patients rather than healthy volunteers.
Investors commonly evaluate:
Serious adverse events and dose-limiting toxicities.
Maximum tolerated dose or recommended dosage.
Pharmacokinetics, which describe how the body processes a drug.
Pharmacodynamics, which describe how a drug affects the body.
Early signs of effectiveness can be encouraging. However, small studies may not reliably predict results in larger patient populations.
Phase 2: Proof of Concept & Efficacy Testing
Phase 2 studies examine whether a treatment shows preliminary effectiveness in patients with the target condition. Researchers also gather additional safety information and refine treatment protocols.
Important questions include:
Did the treatment meet its primary endpoint?
Was the improvement clinically meaningful?
How did results compare with the control group?
Were safety findings acceptable?
Does the evidence justify further testing?
A primary endpoint is the main outcome used to evaluate a trial's central research question. For example, an oncology study may measure tumor response or progression-free survival. The appropriate endpoint depends on the disease and study design.
A positive Phase 2 result may support further development. However, Phase 3 trials can produce different outcomes in larger populations.
Phase 3: Pivotal Trials & Statistical Significance (p-values)
Phase 3 trials generally evaluate effectiveness and safety in larger patient populations. These studies often provide important evidence for regulatory approval applications.
Investors frequently encounter the term p-value when reviewing clinical results. A p-value measures how compatible observed results are with a statistical hypothesis. It does not measure the probability that a treatment works.
A p-value below 0.05 is a common statistical threshold. However, significance requirements depend on trial design, testing procedures, and regulatory expectations.
Consider a hypothetical study reporting:
Treatment response rate: 48%.
Control response rate: 32%.
Reported p-value: 0.03.
The difference may provide evidence against the study's null hypothesis. However, it does not establish the treatment's full clinical value. Investors should also examine confidence intervals, effect sizes, adverse events, and the prespecified analysis plan.
Statistical significance and clinical importance are different concepts. A statistically significant improvement may offer limited practical benefit. Conversely, an encouraging result may require further evidence.
The FDA's E9 Statistical Principles for Clinical Trials provides additional context.
FDA PDUFA Dates and Advisory Committee Meetings
FDA regulatory events can become important stock market catalysts.
A PDUFA date refers to a target date for FDA action under the Prescription Drug User Fee Act review process.
For applicable original new molecular entity and biologics applications, standard review generally targets ten months from filing. Priority review generally targets six months from filing. These are review goals, not approval guarantees.
A company may receive approval, a Complete Response Letter, or another regulatory outcome. Review timelines can also change under applicable circumstances.
Another important event is an FDA advisory committee meeting.
Advisory committees provide independent scientific recommendations about regulatory questions. Their discussions may address effectiveness, safety, clinical evidence, or proposed labeling.
The FDA makes the final regulatory decision. Advisory committee recommendations are not legally binding. Investors can review FDA advisory committee information before interpreting meeting outcomes.
Building a Biotech Catalyst Calendar
A catalyst calendar tracks events that may materially influence a company's valuation. Examples include trial readouts, completion dates, New Drug Application submissions, PDUFA dates, advisory committee meetings, and financing announcements.
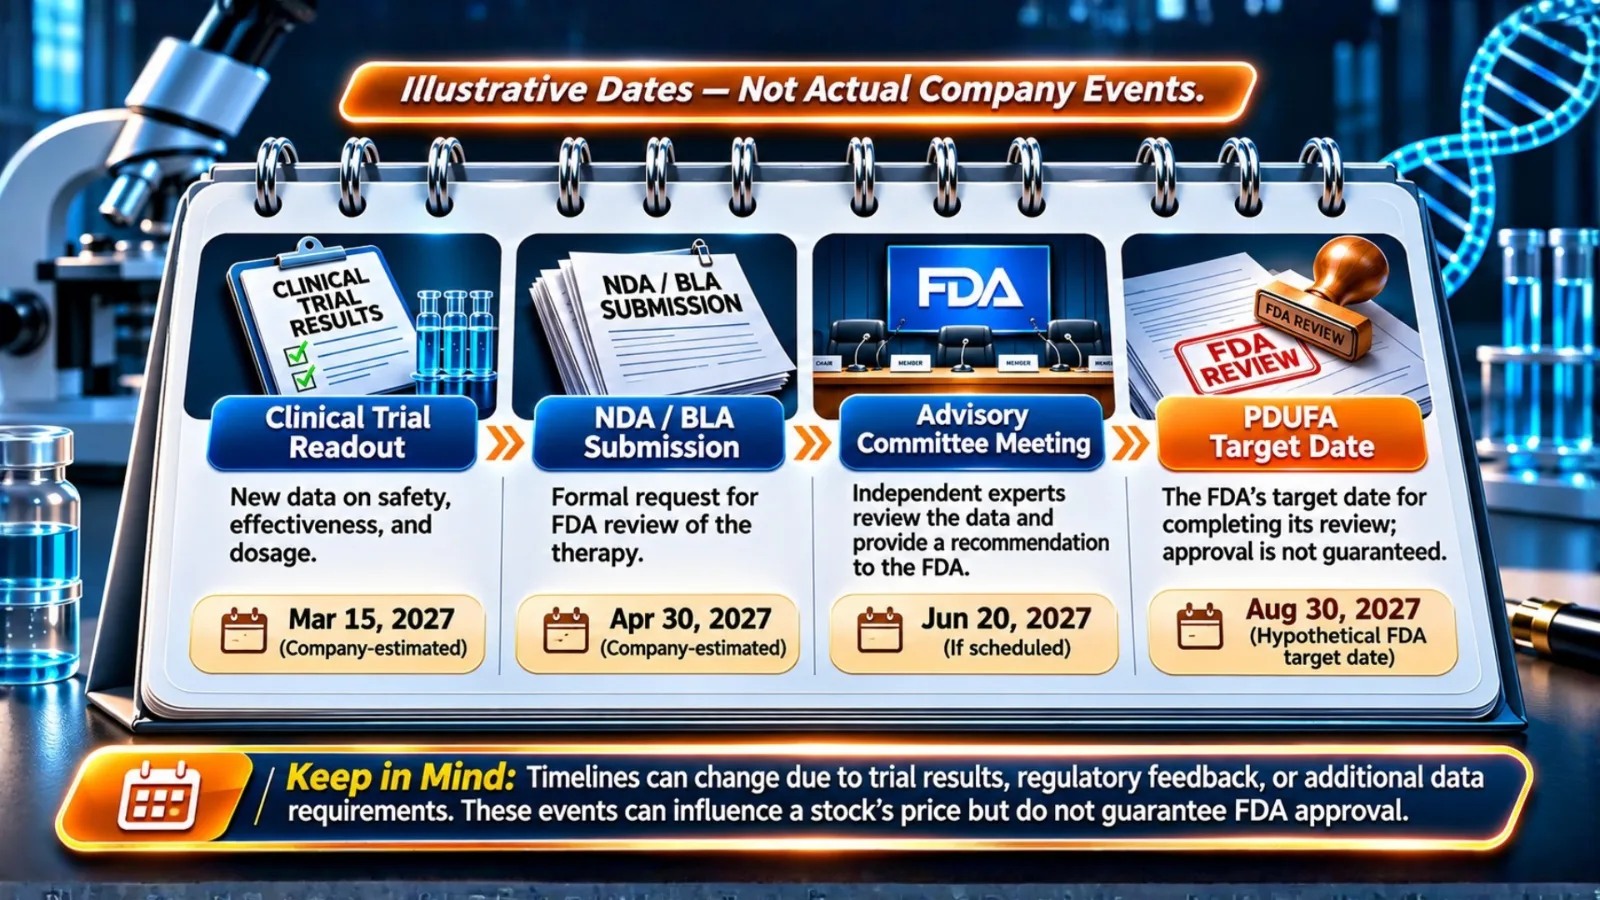
ClinicalTrials.gov provides trial identifiers, study designs, endpoints, and completion estimates. However, estimated completion dates may change. They also do not necessarily indicate when results will be announced.
A useful trial tracker should separate verified events from company projections. This distinction helps prevent reliance on outdated catalyst information.
Why Cash Runway and Burn Rate Matter in Biotech
Financial analysis is especially important when investing in biotechnology companies without approved commercial products. Clinical trials require funding for research, manufacturing, personnel, regulatory work, and patient monitoring. A company may have encouraging clinical results but insufficient capital to complete its next development stage.
Two financial concepts deserve particular attention.
Cash burn rate measures how quickly a company consumes cash during operations.
Cash runway estimates how long existing cash resources may support operations at an assumed spending rate.
A simplified calculation is:
Cash Runway = Available Cash ÷ Average Monthly Cash Burn
For example, consider a hypothetical biotechnology company:
Cash and short-term liquid investments: $120 million.
Annual operating cash outflow: $60 million.
Average monthly cash burn: $5 million.
Estimated cash runway = $120 million ÷ $5 million = 24 months.
This is an illustrative calculation, not a company forecast. Future spending may increase during larger clinical trials or commercial preparation. Some investments may also be restricted or unavailable for operations.
How to Evaluate 18–24 Months of Capital
An 18–24-month runway can serve as a useful initial screening guideline. It is not a universal financial requirement. The appropriate runway depends on clinical timelines, research costs, debt obligations, and access to financing.

Consider a second hypothetical scenario. The previous company's monthly cash burn increases from $5 million to $8 million. Its estimated runway falls from 24 months to 15 months. This change could affect funding decisions before the next clinical milestone.
Investors can examine several questions:
Does existing cash cover the next important clinical readout?
Could trial expansion increase operating expenses?
Does the company have debt or contractual payment obligations?
Are partnership payments or milestone receipts uncertain?
Might the company issue additional shares?
Share issuance can create dilution, reducing existing shareholders' percentage ownership. Borrowing can also increase financial pressure. Financing availability may deteriorate when market conditions become unfavorable.
Where to Find Cash Runway Information
Quarterly 10-Q reports and annual 10-K reports provide useful financial disclosures. Important sections include:
Cash and cash equivalents.
Marketable securities.
Net cash used in operating activities.
Research and development expenses.
Liquidity disclosures.
Financing and debt obligations.
Investors can access these documents through SEC EDGAR.
The cash flow statement often provides a useful starting point. However, historical spending alone may underestimate future development costs.
Intellectual Property & Commercial Market Size (Total Addressable Market)
Clinical results are only part of a biotechnology company's potential investment value. Investors also need to understand intellectual property, commercialization requirements, and addressable patient populations.
Intellectual property includes patents, proprietary processes, protected technologies, and other legally recognized rights.
Patents may protect particular drug compounds, manufacturing methods, or therapeutic applications.
However, patents and FDA regulatory exclusivity are separate forms of protection. Their duration, scope, and legal implications can differ. The FDA's patents and exclusivity guidance explains these distinctions.
Investors should examine patent expiration dates, competing technologies, licensing agreements, and potential challenges.
Understanding Total Addressable Market (TAM)
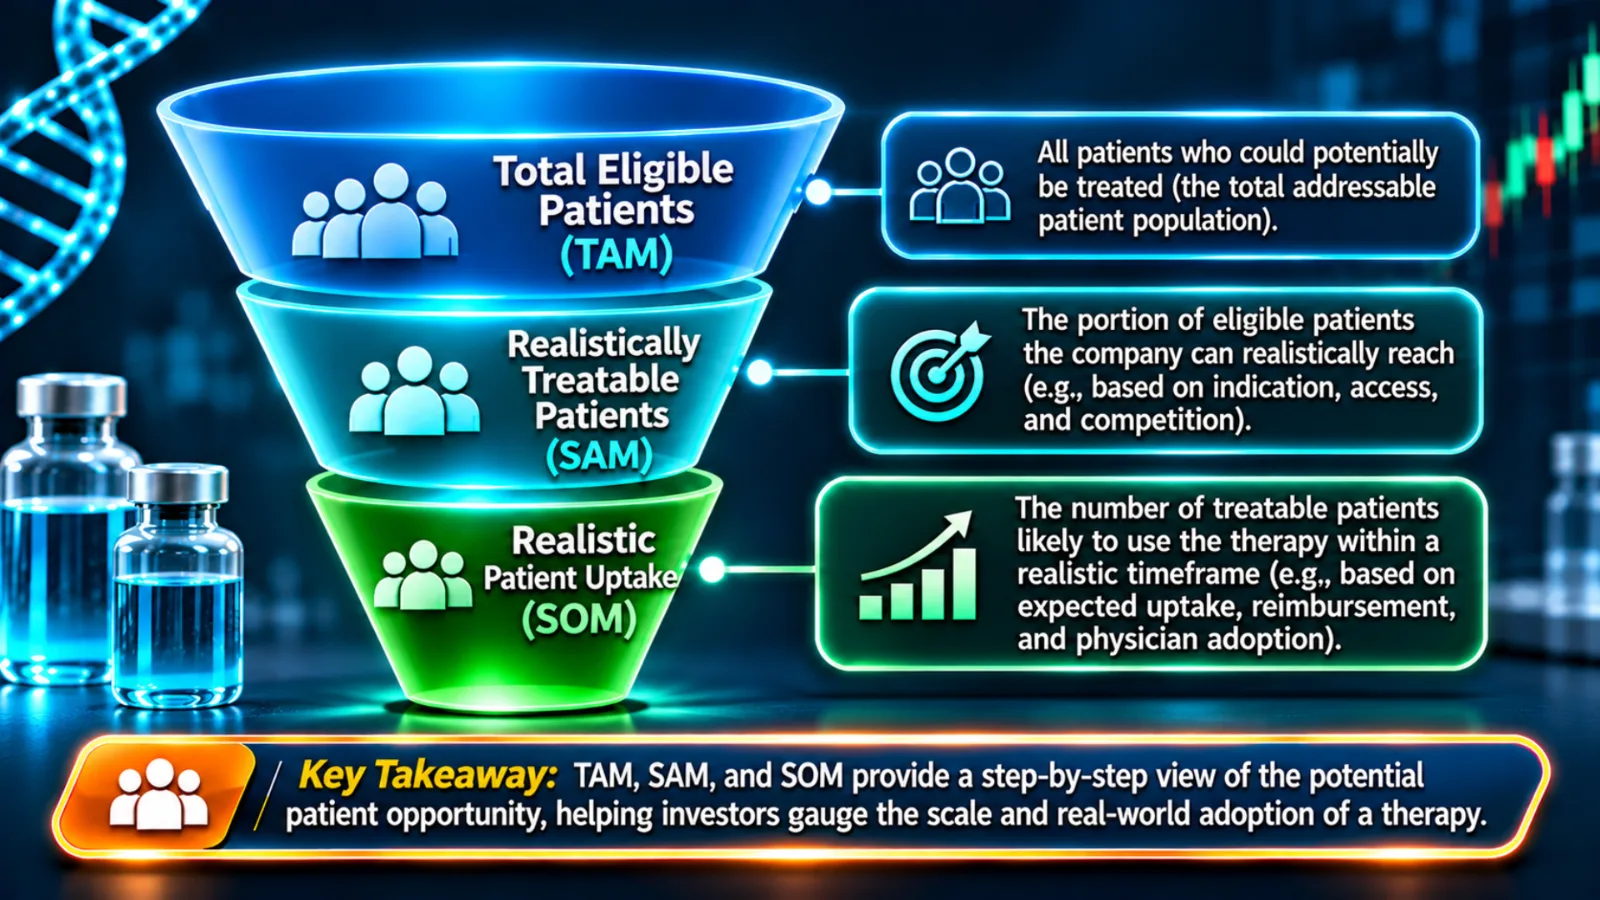
Total addressable market (TAM) estimates the potential revenue opportunity for a product within a defined market. A large patient population does not necessarily translate into an equally large commercial opportunity.
Consider a hypothetical rare-disease treatment:
Eligible patients: 20,000.
Illustrative annual treatment price: $40,000.
Theoretical annual market opportunity: $800 million.
This calculation assumes every eligible patient receives treatment at the stated price. Actual revenue could be substantially lower because of diagnosis rates, reimbursement, competition, and access restrictions. Investors should distinguish total patient populations from realistically treatable populations.
Putting It Together: A Checklist for Evaluating Clinical-Stage Equities
Biotechnology investing combines scientific analysis, regulatory research, financial evaluation, and commercial judgment. A treatment's scientific potential matters, but investors should also consider financing requirements and eventual market adoption.
Before evaluating a biotech company, consider this research checklist:
Clinical stage: Identify the treatment's current development phase.
Trial design: Review endpoints, control groups, and patient populations.
Clinical evidence: Examine effectiveness, statistical results, and safety.
FDA catalysts: Verify regulatory events and decision timelines.
Cash runway: Estimate funding coverage through important milestones.
Dilution risk: Assess potential financing requirements.
Intellectual property: Review patents, exclusivity, and licensing rights.
Market opportunity: Estimate realistic patient demand and commercial adoption.
Valuation: Compare potential outcomes with the company's current market value.
Portfolio exposure: Consider the consequences of an unfavorable clinical result.
Investors looking for biotech stocks with upside should distinguish share price from company valuation. A low-priced stock may still carry substantial downside risk. Likewise, a strong clinical result may already be reflected in the market price.
Diversification can reduce dependence on individual company outcomes. However, it does not remove broad biotechnology sector risks.
How Biotech Insider Approaches Clinical-Stage Risk
Behind the Markets, founded by Dylan Jovine, focuses primarily on mid-cap companies with market capitalizations between $1 billion and $10 billion. Dylan has spent over three decades in the financial industry, starting on Wall Street in 1991 and later founding the brokerage firm Lexington Capital Partners.
Biotech Insider is a Behind the Markets publication focused on smaller biotechnology companies. Its published product description emphasizes companies participating in late Phase 2 and Phase 3 clinical trials. The publication also notes that some research may cover companies at earlier development stages.
This approach reflects an interest in clinical development milestones. It does not remove the financial or scientific risks associated with biotechnology investing.
Readers exploring healthcare investment research can also review Behind the Markets healthcare research. The broader Behind the Markets coverage may provide context for comparing biotechnology companies with businesses in other sectors.
💡 READY TO RESEARCH BIOTECH COMPANIES AND FDA CATALYSTS? Searching for overlooked clinical-stage biotech companies? Biotech Insider is a Behind the Markets publication that researches small and mid-cap biotechnology companies. 👉 Explore the Biotech Insider publication and enjoy its 30-day money-back trial terms. |
|---|
Frequently Asked Questions
What is biotech stock investing?
Biotech investing involves purchasing shares in companies developing medicines, biological treatments, or related healthcare technologies. Investment outcomes depend on clinical progress, regulatory decisions, financing, and commercial performance.
How do beginners invest in biotech stocks?
Investors can research individual biotechnology companies or diversified biotechnology funds. Clinical trial data, financial statements, and valuation risks are useful starting points.
What is the biggest risk in clinical-stage biotech investing?
Clinical failure is a major risk because companies may depend on experimental treatments. Financing difficulties and regulatory setbacks can also materially affect stock valuations.
What is an FDA PDUFA date?
A PDUFA date is an FDA target action date for an applicable drug application. It does not guarantee that the treatment will receive approval.
How much cash runway should a biotechnology company have?
An estimated 18–24 months may be a useful initial screening range. The appropriate amount depends on clinical milestones, spending requirements, and financing access.
Are biotech stocks with upcoming FDA catalysts attractive investments?
Upcoming FDA decisions can affect stock valuations, but outcomes remain uncertain. The current share price may already reflect expectations surrounding the event.
How can investors identify promising biotech stocks?
Investors can examine clinical evidence, financial resources, patents, management disclosures, and realistic commercial opportunities. No single metric determines future investment performance.
Are pharmaceutical stocks different from clinical-stage biotech stocks?
Established pharmaceutical companies often generate revenue from approved products. Clinical-stage biotechnology companies may depend primarily on research funding and future regulatory outcomes.
Sources and Further Reading
Disclaimer & Regulatory Disclosure
Behind the Markets is an independent financial research publisher, not a registered investment adviser or broker-dealer. The information provided in this guide is for general educational and informational purposes only and does not constitute personalized financial, investment, legal, or tax advice. Investing in biotechnology and clinical-stage equities entails substantial risk of loss, including loss of principal. Past performance is no guarantee of future results. Always consult a licensed financial advisor before making any investment decisions.
Found this helpful? Share it with others.
Written by Research Team